The Importance of Telling Stories with Data
General Keneavy Krenzin

Stories are 22 times more memorable than facts. This is why we can recall stories told to us from years ago, yet not remember a simple fact we heard a week ago, or even earlier this morning. It’s no secret that stories are a powerful tool when it comes to sharing information. After all, stories were humanity’s first method of passing knowledge down through generations. But what is data storytelling? Although this term has been talked about for years, there is no clear-cut definition. IT company TDWI encompasses ideas from most definitions floating the internet, they define data storytelling as ‘the practice of building a narrative around a set of data and its accompanying visualizations to help convey the meaning of that data in a powerful and compelling fashion.’ In simpler terms, building a story around data to showcase it in a meaningful way.
What makes stories so much more effective is the emotions that can be formed when hearing a story. These emotions can teach important moral lessons, inspire imaginative thinking, and even guide a customer into completing a certain action (wished for) by a company. According to this article, neuroscience has proved that humans buy primarily on emotion only then to justify their purchase using logic. So, it’s crucial to appeal to their emotions and a great way to do that is through storytelling.
How many times have you found yourself on the edge of your seat at an action movie? Or maybe hiding behind your popcorn while watching a horror film? Shedding a tear during a drama or laughing until it hurts at a comedy? These are just some examples of how we become emotionally connected to movies or book, more specifically the story within them. We often project ourselves into stories or identify with a specific character. We can feel the emotions that the characters experience. A fictional character’s death may leave us feeling as if we’re grieving a real loss. When it comes to sharing information or getting a potential client to understand something stories are a great way to spread knowledge and to make it memorable. Seeing numbers and facts usually doesn’t illicit emotions, using a narrative however serves to align emotions and thinking, leading to data being able to make a greater impact
Zak’s Study
In 2009, Neuroeconomist Paul J. Zak conducted a study focusing on the human brain’s response to hearing a story and whether they donated money to a charity after participating in the study. Participants were divided and viewed one of two videos, both of a father and son. One showcased a father and son walking through a zoo and smiling, no commentary, no backstory.
The second video depicted the same father and son playing together. However, this time a narrator explained that the son had a brain tumor and only had a few months to live. We learn that the father was struggling to keep up a happy front around his son because he knows his death is quickly approaching. However, he wants to be happy and positive around his son until he takes his very last breath. After the subjects watched the video they were given $20 with the option to donate some to a children’s charity or keep it.
Zak found a direct correlation with those who released higher levels of cortisol (a chemical associated with distress) and oxytocin (a chemical associated with empathy) and the amount they donated. The chemicals were released when watching the video with the backstory, not when watching the video without the story. Participants who watched the non-story video rarely donated, while those who watched the video with a storyline donated a lot more often and more money. Even though the characters and their story was fictional, there was still an exponential increase in those who donated to charity when they heard the story verses those who did not.
For more information on Zak’s study click here
The Effects of Storytelling on the Brain
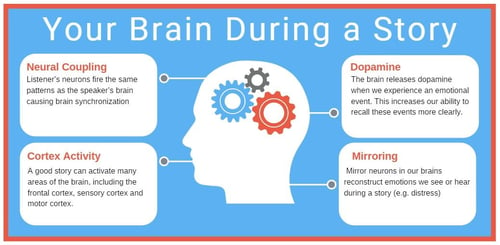
As mentioned in the example above, stories elicit more brain activity because of the connections made and emotions felt when listening to a story. From a chemical standpoint some of the changes the brain experiences are:
- Neural Coupling: Listener’s neurons fire the same patterns as the speaker’s brain causing brain synchronization
- Mirroring: Mirror neurons in our brains reconstruct emotions we see or hear during a story (e.g. distress)
- Cortisol, Oxytocin, and Dopamine: The brain releases dopamine when emotions run high making it easier to recall events with better clarity. During a story that pulls at heartstrings, like Zak’s study, causes a spike in oxytocin which is a neurochemical responsible for feelings or empathy and care. Higher oxytocin is associated with people are more likely to give strangers and charities money as expressed in Zak’s research. Cortisol, also known as a ‘stress hormone’ is responsible for keeping us alert and attentive when listening or seeing stories. The combination of Cortisol (attention), Oxytocin (empathy), Dopamine (memory) and Neural Coupling (connection), the listener can be lead into feeling a certain way and even be guided to a certain behavior.

Four Tips for Data Storytelling
Stories are a great way to communicate what may be a great deal of confusing data. Data can have an important story to tell, but sometimes reading the numbers isn’t enough for others to fully comprehend its scope. Read below for tips on how to tell a story using data.
Use Unbiased Data
Although stories are a great tool, it is important to stay cautious when choosing which research, you are sharing and how it is presented. Storytelling often carries an annotation of being fiction, something to keep in mind while telling stories with data. Knowing this, it is crucial that the data used is unbiased. Making data fit a company’s certain objective is an example of how storytelling can be used to skew results to a coveted, pre-decided narrative, something to avoid if you wish to tell a truthful and informative story. If an audience feels like your story is too skewed or bias, they very well may lose trust in the data or information being presented.
Use Visuals
We discussed a little bit about the importance of visuals in understanding data in our blog ‘The Psychology Behind Business Dashboards’. In business, not everyone thinks in terms of numbers. For example, some think in pictures. Adding visuals to a data story such as graphs, charts, images, or even video helps to keep viewers interested thus strengthening the likeliness that they will be able to form a connection to the story being told. While visuals keep attention, it’s important to note that it is the story told that will drive them to action. Visualization is a powerful way to communicate and represent data, but even more powerful is the ability to connect visuals and tell an overarching story with data.
Get Specific
Having a broad target could make your story unsuccessful because it’s harder to get people to connect to a very general storyline. It is important to find your niche target, so you can tailor your stories for specific audiences. The stronger the connection someone can make, the higher the chance that they will take a desired action.
Narrative is Key
While some people speak the language of numbers and some people prefer images, narrative is the universal language for all the reasons outlined above. We’re taught to interpret narratives our whole lives, from bedtime stories and fairy tales to blockbuster films, musicals, novels, and episodic television shows. However, data is ambiguous and contextually deficient on its own. Even visualizations are subject to interpretation. Adding a narrative to data through storytelling reduces ambiguity, connects data with context, and describes the intended interpretation.
At Agilence we have a reoccurring blog series called ‘Stories for Success’ which tells stories of how Agilence’s software can be used to solve a problem. This is a great way to communicate how Agilence’s software helps solve a business’s dilemmas that may have not even be apparent and thus lead them to better understand their own data while improving their bottom line.
Here at Agilence, we believe that data can be persuasive all on its own, but when combined with storytelling, it has the power to capture attention, convey ideas, fire the imagination, and stir the soul. This type of impact isn’t always possible with data alone. Data storytelling means deeply analyzing data to find important messages and communicating these messages in the most effective ways.
Related Articles

'Building a Bank:' Reduce Losses by Preventing Internal Fraud & Theft
Theft and fraud in retail and restaurants is widely considered a cost of doing business. Internal fraud and organized theft l...
Retail Security Tips to Keep Customers and Staff Safe in Uncertain Times
Retail sales are up, but so are security concerns. As consumers continue to visit brick-and-mortar stores, retailers must add....png)
The LP Endgame: Using Data Analytics To Combat Fraud Schemes
While using analytics to combat fraud isn’t as dangerous as leveling the Infinity Stone-fueled powers of Thanos –anticipating...Subscribe to our blog
Receive free educational resources like exclusive reports, webinars, and industry thought leadership articles straight to your inbox.

